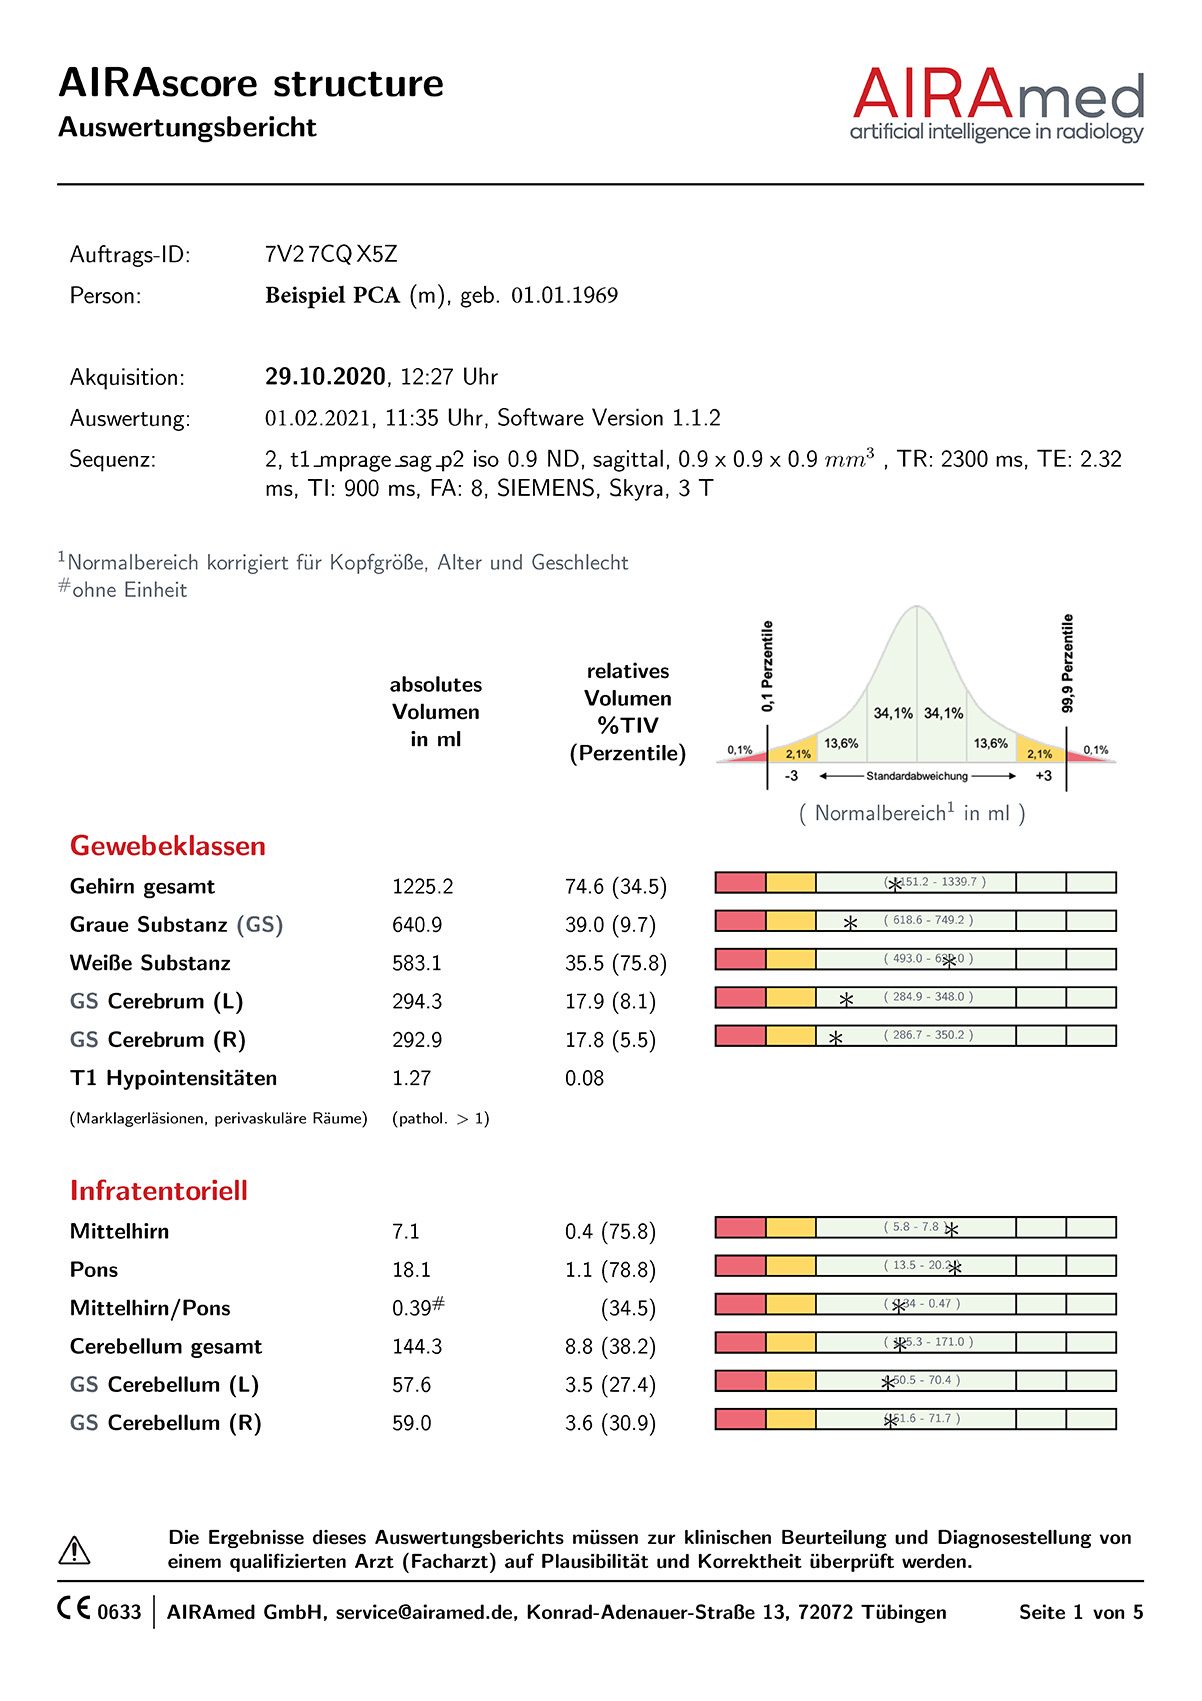
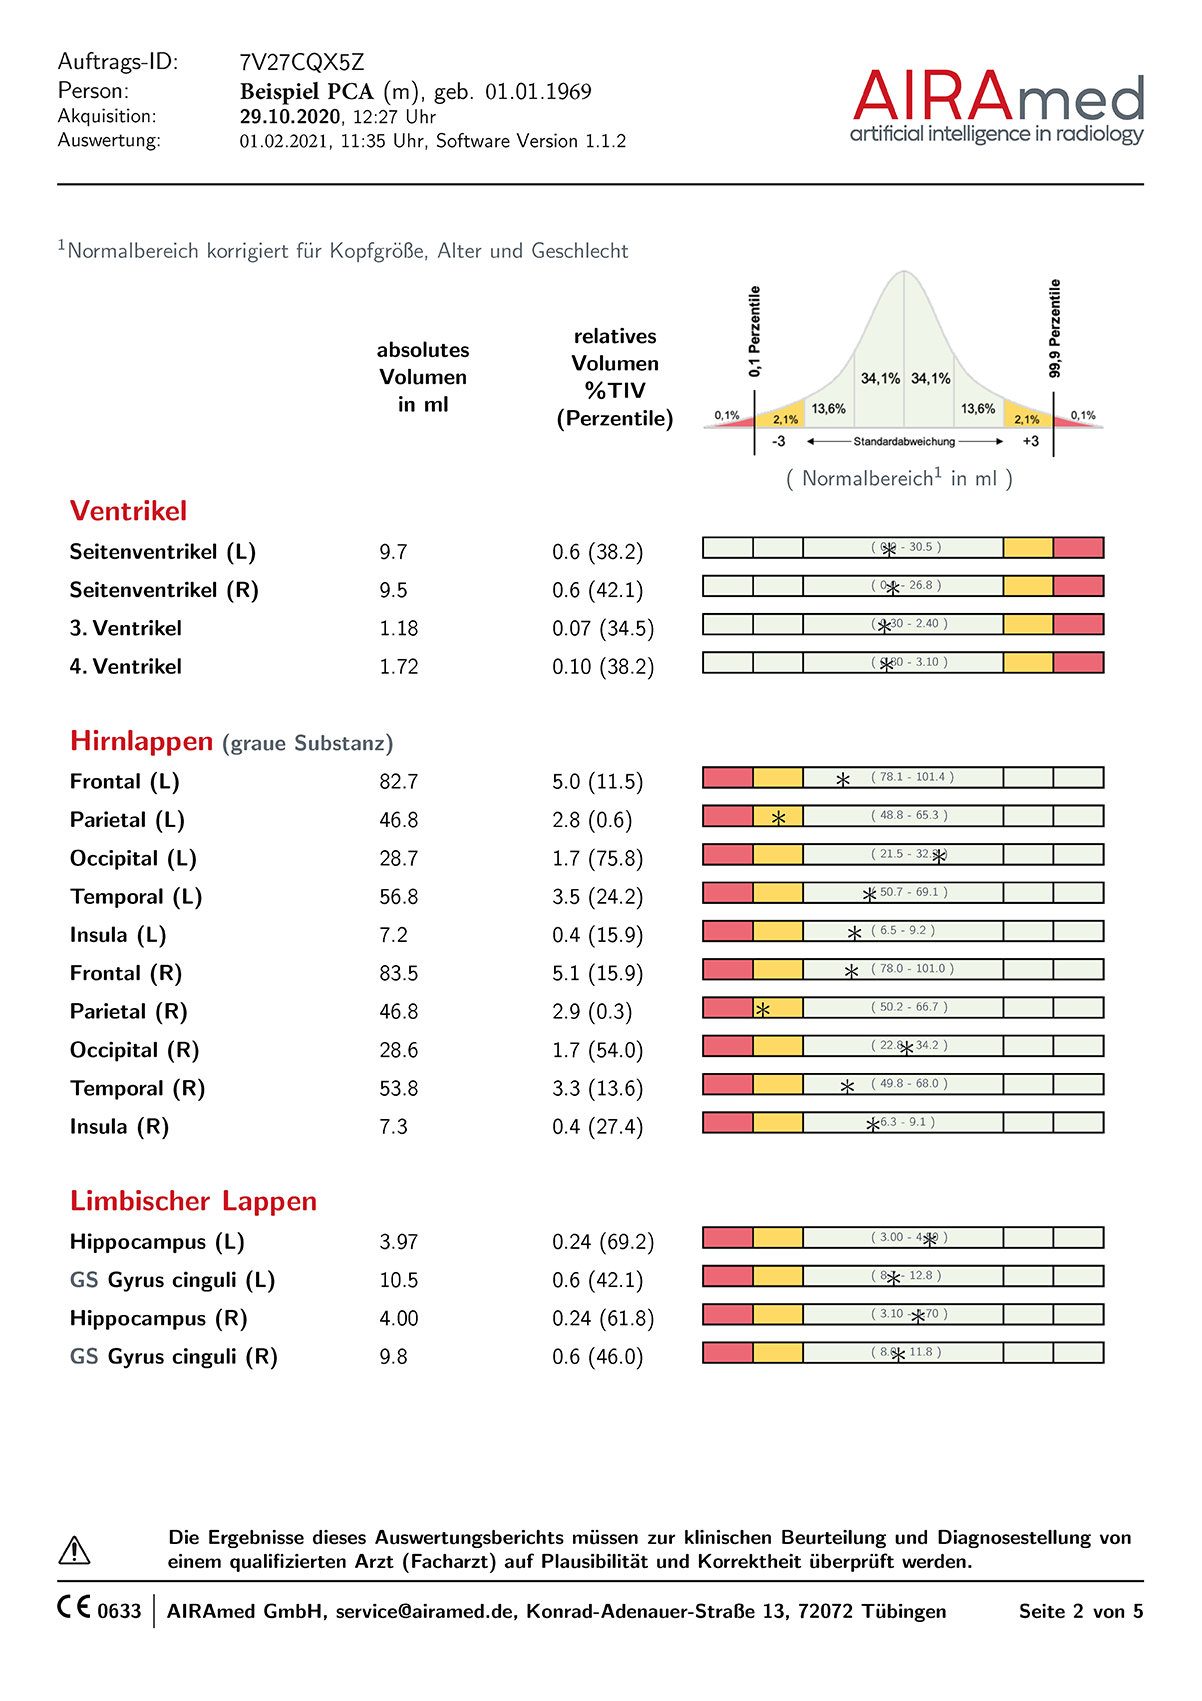
Normal range corrected for head size, age and sex.
Lobes (grey matter)
| absolute volume (ml) | relative volume %TIV (percentile) | normal range (ml) | |
|---|---|---|---|
| Frontal (L) | 82.7 | 5.0 (11.5) | |
| Parietal (L) | 46.8 | 2.8 (0.6) | |
| Temporal (L) | 56.8 | 3.5 (24.2) | |
| Insula (L) | 7.2 | 0.4 (15.9) | |
| Frontal (R) | 83.5 | 5.1 (15.9) | |
| Parietal (R) | 46.8 | 2.9 (0.3) | |
| Occipital (R) | 28.6 | 1.7 (54.0) | |
| Temporal (R) | 53.8 | 3.3 (13.6) | |
| Insula (R) | 7.3 | 0.4 (27.4) |
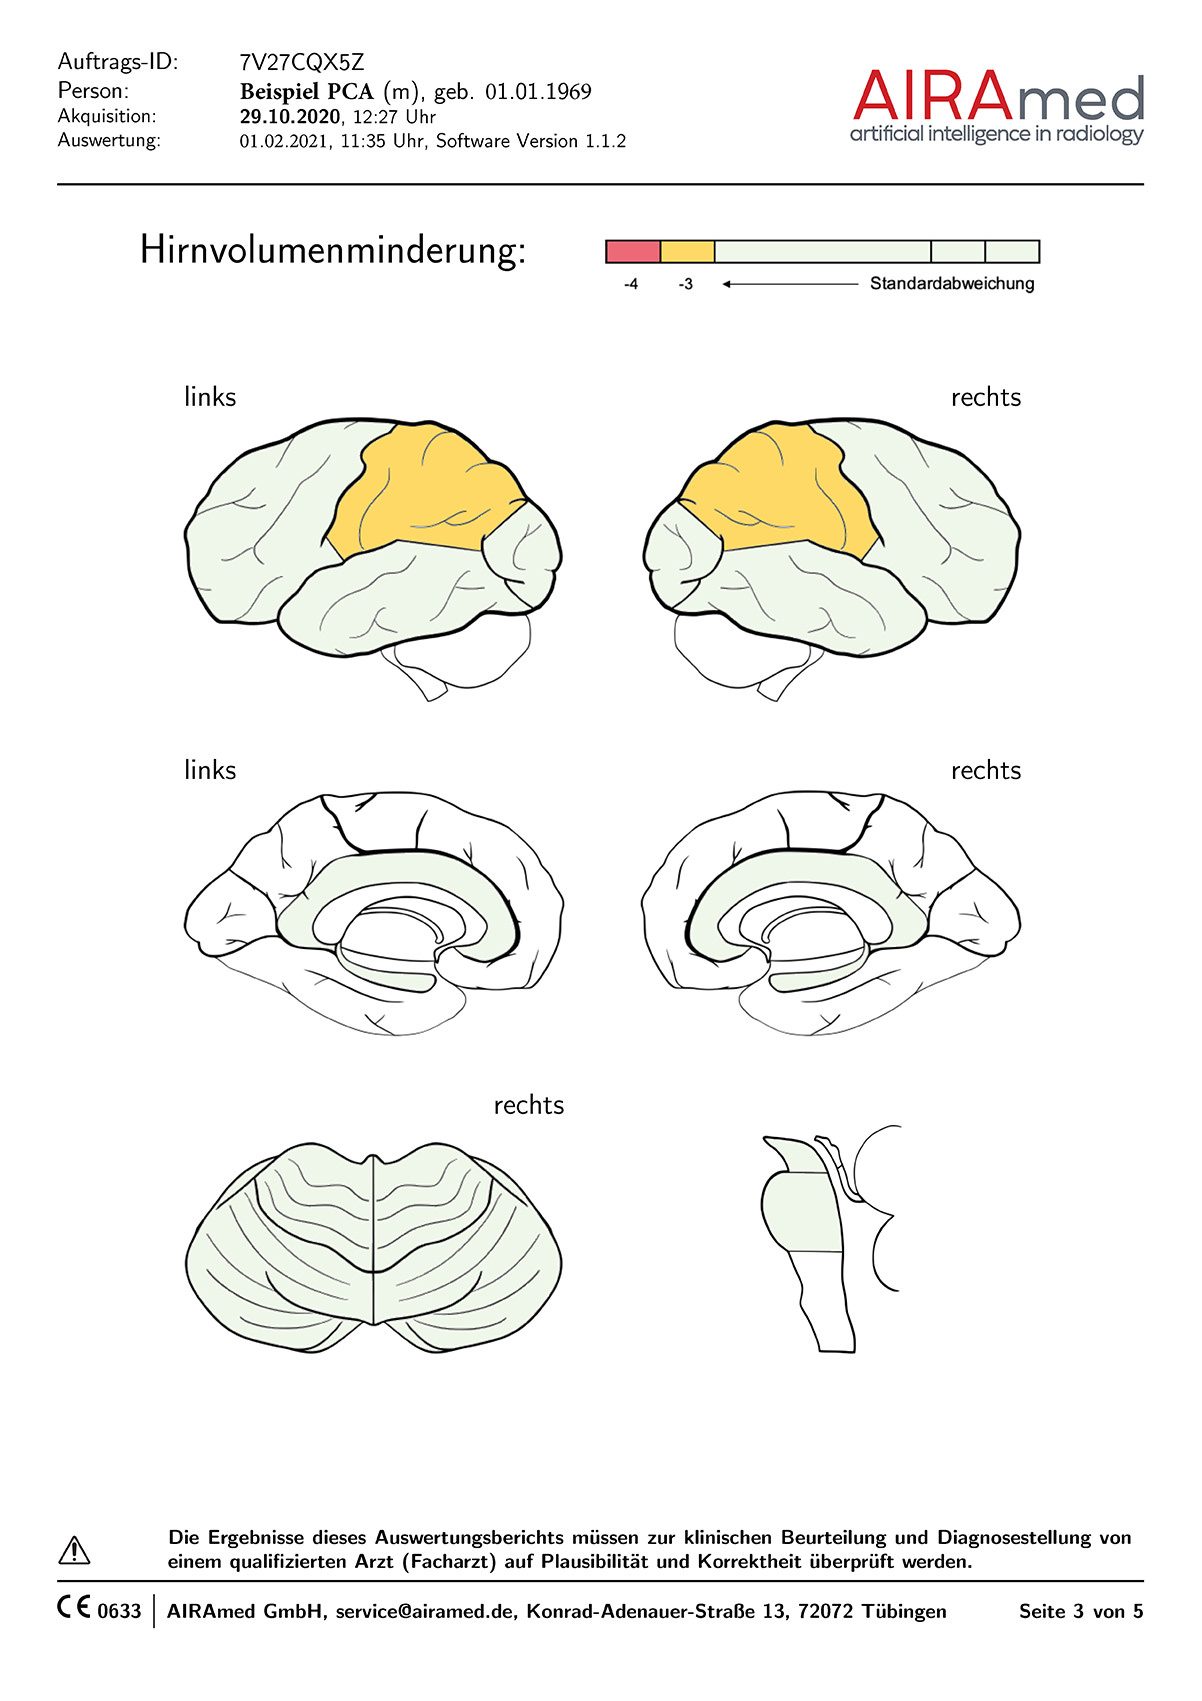
- Normal range (±2 standard deviations)
- −2 to −3 standard deviations
- below −3 standard deviations